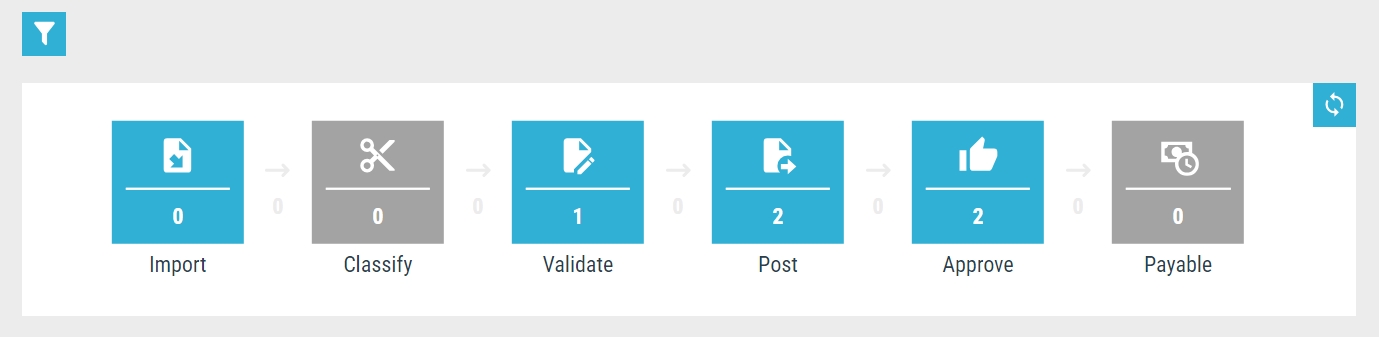
After logging in, users with the role Post in Blue10 will see the dashboard with all steps of the document processing process. These are the sequential steps that a document follows in Blue10. After clicking on a step, it is visible how many documents are ready to be processed per administration, or, for example, how many documents there are to approve per user. Between the steps, an arrow may be visible when a document moves from one step to the next. An example is that after splitting a document, it moves from the step Classify to the step Validate.
Updating the Dashboard
Have you just performed an action and want to update the dashboard? The quickest way to do this is to click on the icon with the two arrows in the top right of the dashboard. The dashboard is also refreshed with the F5 key or when you log back into the Blue10 service.
Filters on the dashboard
It is possible to filter the dashboard based on type of document and companies. Follow these steps:
- On the Dashboard, click on the filter icon.
- Below the heading Filter by type of document, you can find the following filtering options:
- Selected documenttypes: Selected types of documents are shown in blue and are displayed on the dashboard. Click a type of document to select and filter.
- Available documenttypes: Available type of documents are shown in white in the right column and are not shown on the dashboard. Click a type of document to add it to the selected type of documents to include in the filtering.
- Below the heading Filter company you will find the following filtering options:
- Select all: Click on this button to include all companies in Blue10 in the filtering and show them on the dashboard.
- Deselect all: Click on this button to filter out all companies in Blue10 and not show them on the dashboard. Note: Select a company after this, otherwise the dashboard will not show any data.
- Search company: Look up a company in Blue10 here to select it or deselect it in the filtering.
- Selected: Selected companies are in blue and are shown on the dashboard. Click on a company to deselect and filter it out.
- Available: Available companies are in white in the right column and are not shown on the dashboard. Click on a company to add it to the selected companies and include it in the filtering.
- Click Save to save the filtering. The filtering is visible on the dashboard.
- The filtering can be adjusted by clicking on the filter again. You can delete the filter by clicking on the trash can icon on the right side of the white bar.
Icons on the dashboard
There are several icons on the dashboard. Each icon has a meaning:
| To do: Describes what action is required, such as classifying, validating, posting, approving, etc. | |
| Attention: The exclamation mark indicates that a document requires attention. For example: ‘document action(s) delayed’ or expiration date notifications. | |
| Error message: While performing an action, the document got into an error. The description contains more information about the error message. For example: the document can’t be posted. |
